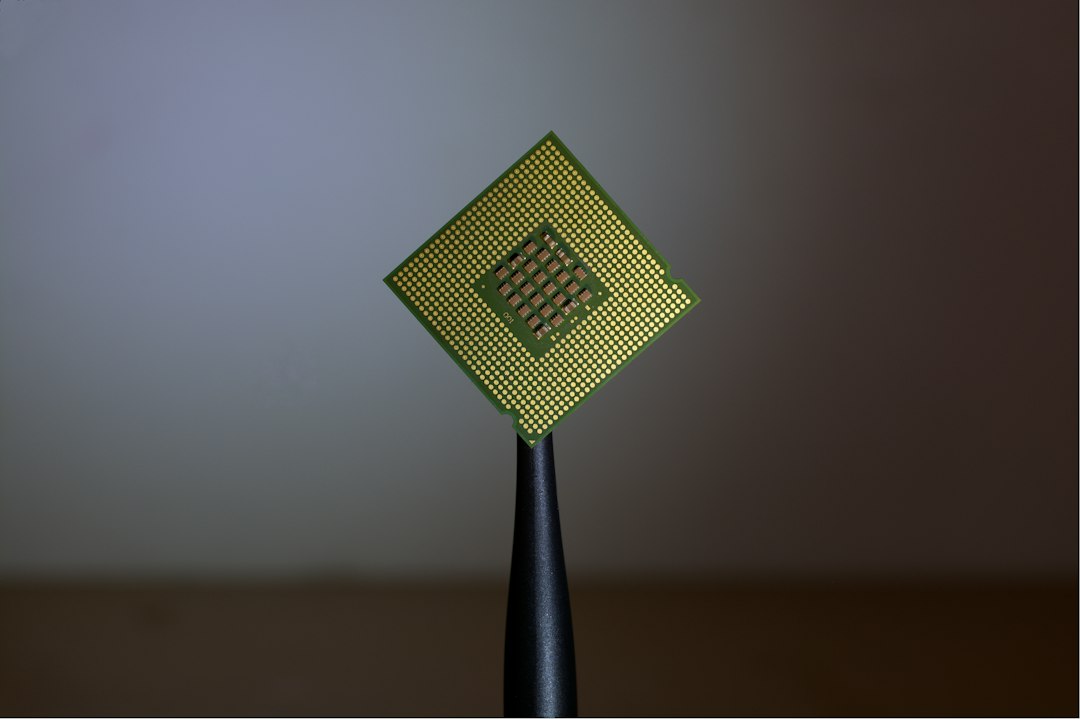
Photo by Brian Kostiuk on Unsplash
Instruction Cache Misses: When Branch-Heavy Code Slows CPUs
Modern CPUs can execute instructions at extraordinary rates, but only when those instructions are already waiting in the instruction cache. When the processor guesses wrong about which code to fetch next, or when that code isn’t cached, execution stalls while the CPU waits for instructions to arrive from main memory. These instruction cache misses are a frequent but often overlooked performance bottleneck in branch-heavy code.
Why Instruction Caches Miss
CPUs fetch instructions ahead of execution using branch prediction. When the predictor is confident about the next block of code, the processor prefetches those instructions into the L1 instruction cache (I-cache). But two scenarios cause misses: unpredictable branches that defeat the predictor, and code scattered across too many memory pages to fit in the cache.
The first problem appears in dispatch loops, interpreters, state machines, and polymorphic call sites. When the CPU can’t reliably predict which branch will be taken, it can’t prefetch the right instructions. Even if the predictor learns the pattern eventually, the first few iterations pay the miss penalty.
The second problem is structural. Modern L1 I-caches are small—32KB to 64KB in most server CPUs. A single hot path might span dozens of functions scattered across different compilation units. If those functions aren’t laid out contiguously in memory, the working set exceeds cache capacity, and the processor thrashes as it repeatedly fetches the same instructions from L2 or L3.
The Cost Is Real
An L1 I-cache hit delivers instructions in one to two cycles. An L2 hit costs 10 to 15 cycles. An L3 hit takes 40 to 60 cycles. A miss that reaches DRAM can stall the frontend for 200 cycles or more. In tight loops where each iteration runs only a few hundred instructions, even occasional misses destroy throughput.
Branch mispredictions compound the problem. When the CPU realizes it fetched the wrong instructions, it must flush the pipeline, discard speculative work, and start fetching from the correct address. The combined penalty of the misprediction and the subsequent I-cache miss can approach 50 to 100 cycles.
This matters most in workloads dominated by control flow: JSON parsers, regex engines, database query executors, bytecode interpreters, and network protocol handlers. These systems spend more time deciding what to do next than doing arithmetic, and each decision risks an I-cache miss.
Mitigation Strategies
Profile-guided optimization (PGO) reorders functions so hot paths are laid out contiguously. By analyzing runtime behavior, the compiler clusters frequently-executed code together, improving spatial locality. This single change can reduce I-cache misses by 20 to 40 percent in branch-heavy applications.
Inlining eliminates indirect calls and merges code into a single address range, but it trades I-cache efficiency against code size. Aggressive inlining can bloat binaries and paradoxically increase cache pressure if rarely-used paths get inlined into hot loops. The right balance depends on the call graph and execution profile.
Manual code layout uses compiler hints or linker scripts to group hot functions. Some systems go further, placing the entire hot path in a dedicated section or even a separate shared library loaded into reserved address space. This ensures the critical code fits in L1.
Computed goto and jump tables replace switch statements in interpreters, turning unpredictable indirect branches into more cache-friendly table lookups. While the branch remains indirect, the target addresses cluster in memory, improving I-cache behavior when the working set is small.
When It Matters
I-cache misses are invisible in compute-bound workloads. A tight numerical loop that fits in a few dozen bytes never leaves L1. But in systems where code paths diverge frequently—web servers routing requests, compilers traversing ASTs, or game engines updating heterogeneous entities—the I-cache becomes the bottleneck long before the ALUs saturate.
Profiling tools like perf expose I-cache miss rates through hardware counters. If L1-icache-load-misses contributes more than 5 percent of frontend stalls, layout and branch predictability are likely limiting performance. The fix isn’t faster hardware—it’s smarter code organization.