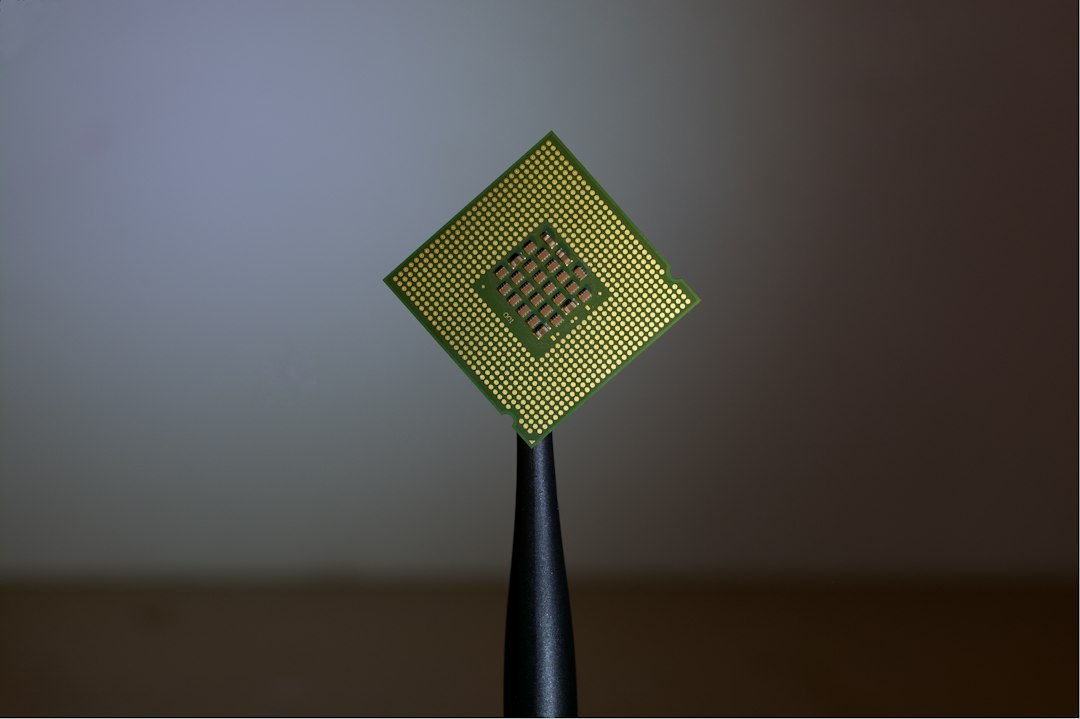
Photo by Brian Kostiuk on Unsplash
Instruction Cache Pressure in Modern Applications
The Forgotten Half of the Cache Hierarchy
When developers talk about cache performance, they almost always mean data cache. L1, L2, L3 hit rates. Prefetching strategies. Cache-friendly data structures. But modern CPUs maintain a parallel cache hierarchy for instructions, and instruction cache (I-cache) misses can be just as expensive as data cache misses—sometimes more so, because a stalled instruction fetch pipeline blocks everything downstream.
Instruction cache pressure has become a first-order concern in high-performance systems. Large codebases, dynamic dispatch, virtual calls, and heavy use of shared libraries all contribute to poor instruction locality. The result is a frontend bottleneck: the CPU spends cycles waiting for the next instruction to execute rather than doing useful work.
Why Instruction Cache Misses Hurt
A typical L1 instruction cache is 32KB to 64KB, much smaller than the total working set of a modern application. When the processor needs an instruction that isn’t in the I-cache, it must fetch it from L2, L3, or main memory. Unlike data accesses, instruction fetches are serial—the CPU cannot begin decoding and executing an instruction until it has been fetched.
Branch mispredictions make this worse. When the branch predictor guesses wrong, the speculative instruction stream is discarded and the correct path must be fetched from scratch. If those instructions aren’t in the I-cache, the penalty is severe: tens or hundreds of cycles lost to memory latency.
The problem compounds in server applications with large codebases. A monolithic binary with millions of lines of code will have hot paths scattered across many different translation units. Without careful attention to layout, related functions end up far apart in the address space, resulting in poor spatial locality and frequent I-cache misses.
Code Layout Matters
One solution is profile-guided optimization (PGO). Modern compilers can use runtime profiling data to reorder functions and basic blocks, placing hot code together and cold code elsewhere. This improves I-cache utilization by packing frequently executed instructions into a smaller address range.
The impact can be dramatic. Google reported 10-20% performance improvements in production services after enabling PGO. Meta’s BOLT (Binary Optimization and Layout Tool) performs post-link binary rewriting to optimize code layout even further, with measured improvements of 5-15% on large C++ binaries.
Link-time optimization (LTO) helps by giving the compiler visibility across translation units, allowing better inlining and layout decisions. But LTO and PGO come with build-time costs and complexity, which is why many projects still ship without them.
Architectural Trends
Modern CPU architectures have responded to instruction cache pressure with larger I-caches and more sophisticated frontend designs. Intel’s recent microarchitectures increased L1 I-cache associativity to reduce conflict misses. ARM’s Neoverse cores use fetch-directed prefetchers that predict instruction access patterns and speculatively fetch instructions before they’re needed.
Some designs decouple instruction fetch from execution using large micro-op caches. Intel’s µop cache stores already-decoded instructions, bypassing both I-cache and decode stages for hot loops. This effectively increases the working set that can execute without frontend stalls.
Virtual Calls and Dynamic Dispatch
Object-oriented languages with heavy use of virtual methods create additional instruction cache pressure. Each virtual call involves an indirect branch through a vtable, and the target address varies with the runtime type of the object. This scatters instruction fetches across many different functions, each potentially in a different cache line.
Devirtualization optimizations help when the compiler can prove the concrete type at a call site. Link-time optimization and whole-program analysis expand the scope for devirtualization, reducing indirect branches and improving instruction locality.
Shared Libraries and PLT Overhead
Position-independent code and procedure linkage tables (PLT) add another layer of indirection. Calls to shared library functions go through a PLT stub, which introduces an extra branch and increases instruction working set. On hot paths, this measurably degrades performance.
Static linking eliminates PLT overhead but increases binary size and complicates deployment. Some teams use selectively static linking—dynamically linking infrequently called dependencies while statically linking hot libraries.
Measuring and Improving
Linux perf can measure instruction cache misses with hardware performance counters: perf stat -e L1-icache-load-misses,instructions. If misses per thousand instructions (MPKI) is above single digits, instruction cache pressure is a likely bottleneck.
Tools like perf record -e cycles:pp with instruction pointer sampling reveal which functions suffer most from frontend stalls. Flame graphs filtered by CPU frontend metrics highlight areas where code reordering would help.
The payoff from optimizing instruction cache behavior is real, but it requires profiling infrastructure, build system changes, and a shift in how developers think about performance. In workloads dominated by large codebases and frequent branching, instruction cache optimization is no longer optional.