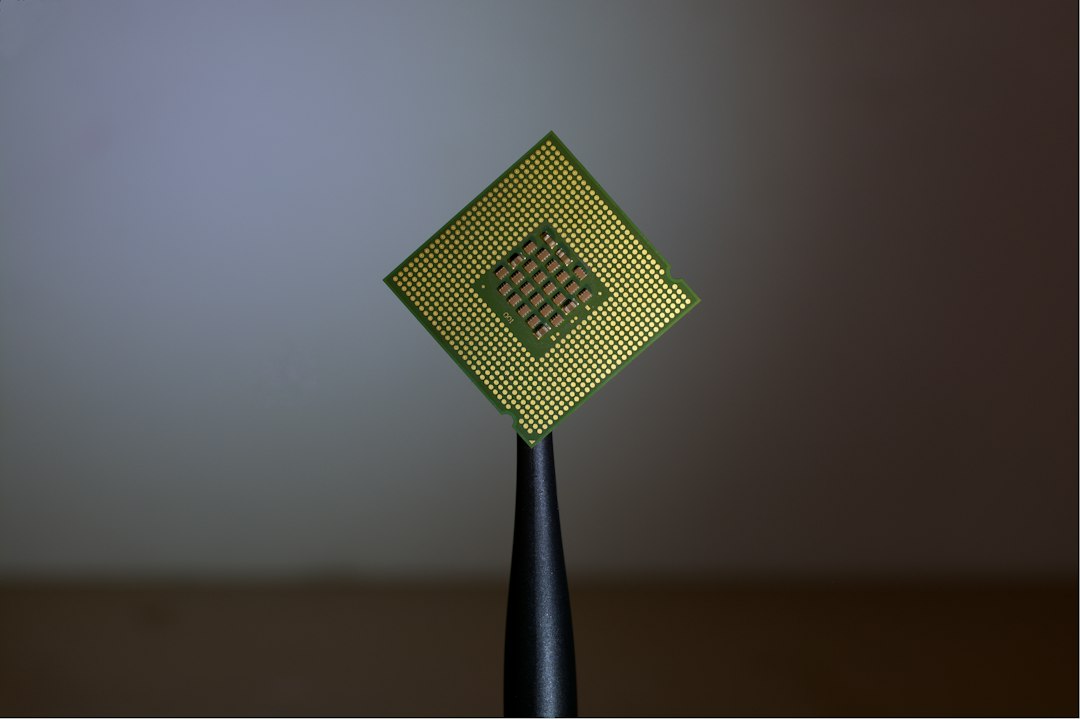
Photo by Brian Kostiuk on Unsplash
Kernel TLB Flushes: When Virtual Memory Translation Gets Expensive
Every memory access in a modern system goes through address translation—virtual addresses used by programs must be converted to physical addresses that reference actual DRAM. The Translation Lookaside Buffer (TLB) caches these translations to avoid expensive page table walks on every load and store. But when the kernel invalidates these cached translations through a TLB flush, the performance impact can be significant and surprisingly widespread.
Why TLB Flushes Happen
The kernel flushes the TLB whenever the mapping between virtual and physical memory changes. This includes operations like unmapping pages during memory reclamation, changing page permissions for security isolation, updating page tables during process context switches, and remapping memory in response to system calls like mprotect or munmap.
Each of these operations requires the kernel to ensure that stale translations don’t cause programs to access the wrong physical memory or bypass security checks. The only way to guarantee this is to invalidate the affected TLB entries, forcing the CPU to reload them from the page tables on the next access.
The Multi-Core Problem
On a single-core system, flushing the TLB is straightforward: invalidate the local entries and move on. On multi-core systems, the problem becomes more complex. If a page mapping changes on one core, any other core that has cached that translation must also flush its TLB entries. Otherwise, cores could have inconsistent views of memory.
This requires inter-processor interrupts (IPIs). The core making the change must send an interrupt to every other core that might have cached the translation, wait for them to acknowledge the flush, and only then can it proceed. These IPIs are synchronous and blocking—they stall the initiating core until all target cores respond. On systems with dozens or hundreds of cores, the latency can add up quickly.
Write-Heavy Workloads Pay the Price
Applications that frequently allocate and deallocate memory, change memory permissions, or perform operations like fork will trigger frequent TLB flushes. Database systems that use large shared memory regions with dynamic access patterns, garbage collectors that remap or release memory in bulk, and containerized environments that spawn and destroy processes rapidly all fall into this category.
The performance impact shows up as increased system time in profiling tools, often attributed to page fault handling or memory management code paths. But the real cost isn’t just the CPU cycles spent walking page tables after the flush—it’s the IPI latency and the stall time waiting for other cores to respond.
Batching and Lazy Invalidation
Modern kernels employ several strategies to reduce TLB flush overhead. Batching allows the kernel to accumulate multiple page table changes and issue a single flush for all of them, amortizing the IPI cost. Lazy invalidation defers the flush until the next context switch or until the core accesses the affected memory, avoiding the immediate synchronous cost.
Some architectures support tagged TLBs, where each entry includes an address space identifier. This allows the kernel to switch between processes without flushing the entire TLB, since entries from different address spaces won’t collide. ARM’s ASID and x86’s PCID features implement this optimization, significantly reducing context switch overhead.
Hardware and Workload Interaction
The size and associativity of the TLB matter. Smaller TLBs flush faster but miss more often. Larger TLBs cache more translations but take longer to search and invalidate. Workloads with large working sets benefit from huge pages, which reduce the number of TLB entries needed and make flushes less frequent.
The architecture’s page table structure also plays a role. Multi-level page tables require more memory accesses on a TLB miss, making flushes more expensive in terms of subsequent refill cost. Hardware page table walkers help, but they’re still slower than a TLB hit by an order of magnitude.
Observing the Cost
Perf on Linux exposes TLB flush events through hardware performance counters. Metrics like tlb:tlb_flush and ipi:ipi_send_cpu can reveal how often flushes occur and how much time is spent in IPI handling. High counts of these events, combined with increased system CPU time, suggest that TLB flush overhead is affecting performance.
The fix isn’t always obvious. Reducing memory churn helps, as does consolidating allocations to minimize the frequency of page table changes. Using huge pages where appropriate can cut TLB pressure dramatically. In some cases, restructuring the application to avoid frequent permission changes or to batch memory operations can yield measurable improvements.
TLB flushes are one of those costs that remain invisible until they’re not. They don’t show up as a single hot function in a profile, but rather as distributed overhead spread across memory management paths. Understanding when and why they happen is essential to diagnosing performance issues in memory-intensive, multi-core workloads.