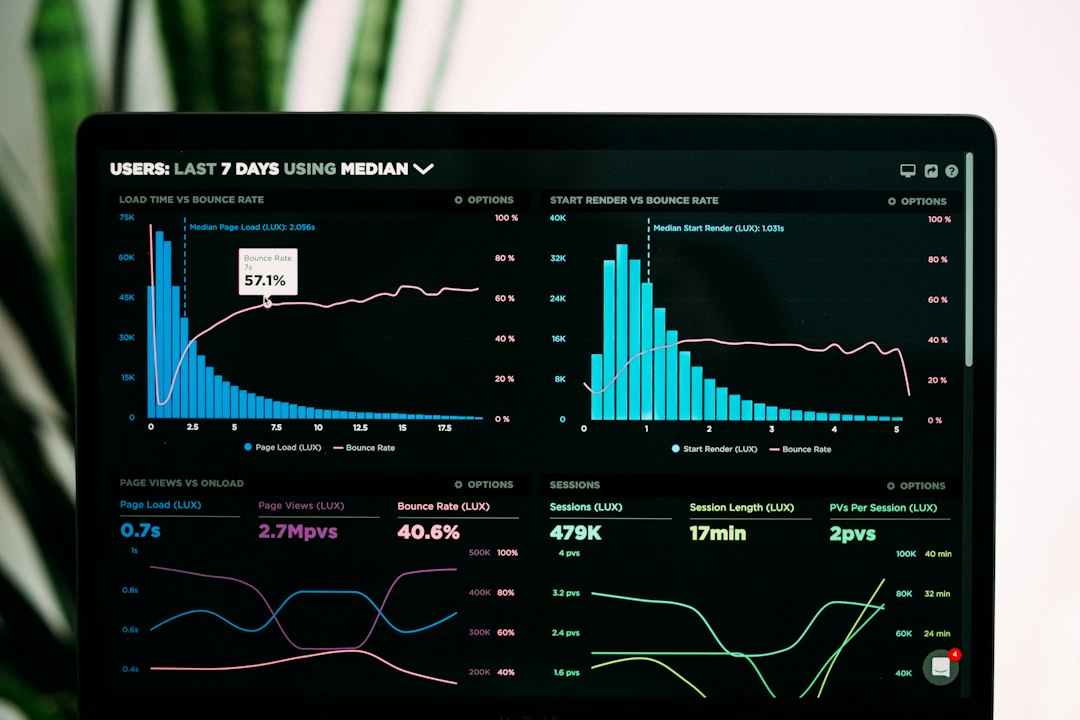
Photo by Luke Chesser on Unsplash
RUM vs Synthetic Monitoring: Why You Need Both
Monitoring web application performance typically happens in two fundamentally different ways: watching real users interact with your production system, or simulating those interactions from controlled test environments. Real User Monitoring (RUM) and synthetic monitoring represent opposite approaches to the same goal, and the tension between them reveals something important about what “performance” actually means in production.
How Real User Monitoring Works
RUM instruments the client application itself—usually through JavaScript embedded in web pages or SDKs in mobile apps—to capture actual user sessions as they happen. Every page load, API call, navigation event, and client-side error gets recorded and transmitted back to your observability platform. You see exactly what your users see: the full distribution of load times across different devices, networks, geographic regions, and usage patterns.
The data is comprehensive but messy. A user on a failing cellular connection in rural Montana produces different metrics than someone on fiber in San Francisco. RUM captures both, along with every browser version, ad blocker configuration, and flaky network condition your users encounter. This is the ground truth of user experience, but it’s also reactive—you only learn about problems after real users hit them.
Synthetic Monitoring: Controlled Observation
Synthetic monitoring inverts this model. Instead of waiting for users, you run scripted transactions against your application from fixed monitoring locations at regular intervals. These scripts simulate user journeys—logging in, searching for a product, completing checkout—and measure response times, error rates, and functional correctness.
Because synthetic tests run on a schedule from known environments, they establish a baseline. A sudden spike in synthetic response times tells you something changed in your infrastructure before users notice. You can monitor critical paths that see little organic traffic, test from regions where you have few users, and verify that authentication flows work even at 3 AM on Sunday when nobody’s actually logging in.
The tradeoff is obvious: synthetic monitoring only measures what you script it to measure, and it runs from data center networks that don’t match real user conditions. It’s a probe, not a census.
Why the Dichotomy Matters
The difference isn’t just operational—it’s epistemological. RUM answers “what is happening to users right now?” Synthetic monitoring answers “is the system working as designed?” These are related questions but not identical ones.
A mobile app might show excellent synthetic test results from AWS monitoring agents while RUM data reveals that 20% of actual users on older Android devices experience crashes during image upload. The synthetic tests passed because they ran on modern emulators with reliable network conditions. Conversely, a spike in RUM-reported latency might reflect a surge in traffic from a slow network region rather than a backend performance regression—something synthetic monitoring from your usual probe locations would clarify.
Using Them Together
Production observability strategies combine both. Synthetic monitoring acts as a continuous integration test against production, catching regressions and verifying SLA compliance for critical transactions. It’s the first line of defense and the source of truth for “is it down?”
RUM provides the context synthetic tests can’t: which features see the most friction, how performance degrades under real-world network conditions, where users abandon flows, and what the actual 95th percentile experience looks like across your user base. It turns synthetic baselines into actionable insight by showing you where the median user experience diverges from your controlled tests.
The two modalities also serve different alerting needs. Synthetic failures trigger immediate incident response—something is broken in a way that affects core functionality. RUM anomalies often indicate slower-burning issues: a mobile OS update causing performance degradation, a third-party script slowing down pages, or a CDN edge location serving stale content.
The Cost-Performance Calculation
Synthetic monitoring costs scale with the number of scripts, probe locations, and execution frequency. You pay for every test run whether your application is serving traffic or idle. RUM costs scale with traffic volume and session sampling rates. For a high-traffic application, RUM data can become expensive to ingest and store at 100% sampling, leading teams to sample 1-10% of sessions.
This creates an interesting dynamic: synthetic monitoring gives you complete coverage of scripted scenarios, while RUM gives you sampled coverage of all scenarios. The combination ensures both that your critical paths are always monitored and that you have visibility into the long tail of user experience.